
Research shows that place-based learning that focuses on the New Jersey-specific effects of climate change and the local actions that impact global trends are more likely to make a lasting impact on students.
Using NJ ADAPT Tools to Integrate Climate Data into Curriculum
Developed in partnership with Rutgers Climate and Energy Institute, New Jersey Climate Change Resource Center & Rutgers CMSCE.
Lesson 1: Using Regression to Explore Climate Change Impacts on Mean Seasonal Precipitation or Mean Daily Maximum Temperature in New Jersey
- Students will go to https://climatedashboards.rutgers.edu/ and explore “Climate Change Impacts on Mean Seasonal Precipitation in New Jersey”, or on “Mean Daily Maximum Temperature” for the years 2001-2020. They will record the data points for historical data on a table. They will then plot the points on a scatterplot either on paper, or on Desmos.com (teacher preference). Students will create a line of best fit (using Desmos or visual approximation on paper). Students will discuss the benefits of using a line to represent the data, and make predictions within the data set to compare to the actual values, as well as make predictions based on their lines.
- Lesson Designed for Middle School Mathematics & Science Standards
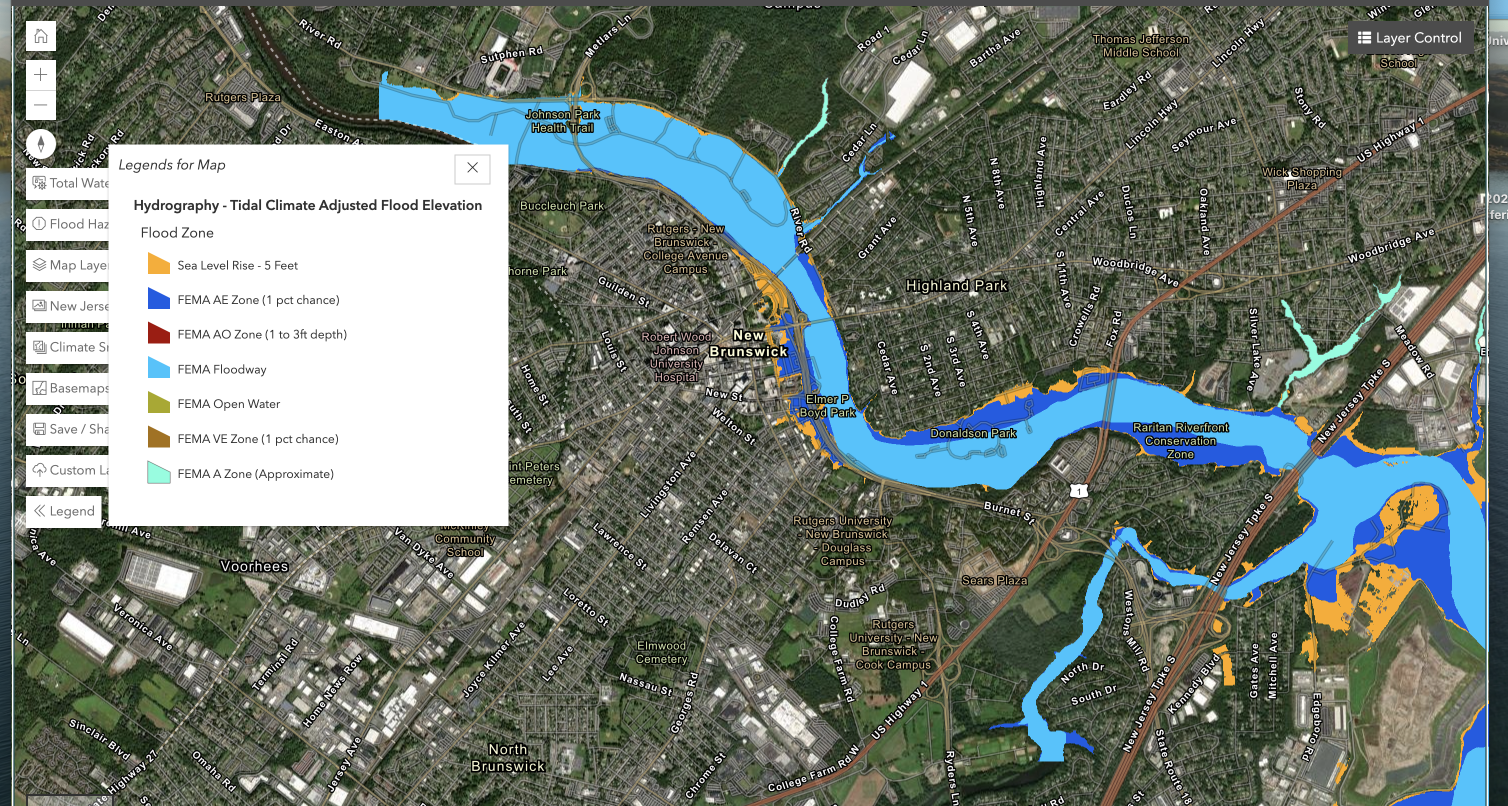
- Lesson 2: Homeowner Helper - Flood Risk Analysis
- Students will use the activity and NJ Adapt flood mapper to analyze risk of flooding to specific areas where people live. They will help make a decision as an objective party about whether homeowners should sell their property to the government through the Blue Acres Program due to flooding risk. Students will use the process of scientific inquiry, and math skills such as arithmetic, analysis, and justification to analyze the flooding situation in specific areas and help homeowners make a decision based on risk. Students will synthesize data gathered from multiple mediums (video, article, government website) to understand the intent and purpose of the Blue Acres Program.
Lesson Designed for Middle School Mathematics, Science, & Social Studies Standards
Lesson 3: My Climate Story
- The lesson "My Climate Story" guides students through an exploration of climate change impacts on their communities using data analysis and visual storytelling. It consists of three parts:
- Notice & Wonder – Students analyze art that represents climate change and discuss findings in small groups.
- Climate Snapshot – They explore climate data from their community using online tools, identifying trends and public health implications.
- Visual Representation – Students create an artistic piece (painting, drawing, digital, or sculpture) that visually represents their climate data and its impact. The project includes an art piece, a written explanation of its significance, and a properly cited data reference. A rubric evaluates creativity, data integration, and clarity in storytelling.
- This lesson encourages students to critically assess climate data and creatively express its effects on their environment.
- Lesson Designed for Middle School Visual & Performance Arts, ELA, and Science (could be adapted for upper elementary or high school)Access All Resources Here
- The lesson "My Climate Story" guides students through an exploration of climate change impacts on their communities using data analysis and visual storytelling. It consists of three parts:
- Lesson 4: Exploring Climate Change with the NJ Adapt Climate Dashboard
In this lesson, students explore real New Jersey climate data using the NJ ADAPT

NJ Adapt Tool - Climate Dashboard Climate Dashboard to understand how scientists track and analyze long-term climate patterns. Students learn the difference between weather and climate, then work with interactive graphs showing variables such as temperature and precipitation. Through guided exploration, students identify trends, interpret visual data, and discuss how climate changes may affect communities and natural systems in New Jersey. The lesson builds data literacy, scientific reasoning, and climate awareness while supporting NJ Student Learning Standards in science, math, and ELA. Students conclude by explaining observed trends and suggesting actions people can take to help address climate change.
Lesson Designed for 5th Grade ELA, Math, and, Science (could be adapted for Middle School)
- Lesson 5: Climate Resilient Cities - Our Town’s Risk
Students will use NJ ADAPT tools to identify possible climate vulnerabilities in their communities. They will overlay maps of projected flooding risk or projected heat risk with maps of community infrastructure to identify these vulnerabilities. They will look for potential vulnerabilities, such as a certain bridge, gas station, water treatment plant, etc, that may be at risk as climate change impacts worsen. Students will create a report identifying these vulnerabilities, discussing why they are at risk, what could possibly go wrong, and what could be done to mitigate this risk. For example, students may identify a water treatment plant at risk of flooding, discuss the negative outcomes that could happen for local wildlife and community members if it flooded, and what would need to be done to avoid this risk.
Lesson Designed for High School ELA, Science, and Career Readiness, Life Literacies, and Key Skills (could be adapted for middle school)
- Lesson 6: Designing Green Spaces for Biodiversity and Climate Resilience
Students will explore urban ecosystems and climate change principles and apply them to urban planning, with an added focus on climate change impacts and resilience. Using NJ ADAPT climate‑mapping tools and local data, students will analyze risks such as heat, flooding, and changing habitat ranges, then redesign a local urban island to enhance biodiversity, ecosystem services, species richness, and climate resilience. Students will create a visual redesign, interpret climate projections, and communicate how their design supports ecosystem services under future climate conditions.
Lesson Designed for High School ELA, Science, and Math(could be adapted for middle school)
- Lesson 7: The Sea Level Number Line
The students will be utilizing NJ Flood Mapper to discover the effects of sea-level rise changes within our community and within NJ. Students explore sea-level rise using the NJ Flood Mapper and a number-line model where 0 represents sea level, positive integers represent dry land, and negative integers represent flooded land. Students calculate new land positions using subtraction and analyze how rising seas affect familiar locations such as schools, parks, and streets.
Lesson Designed for Middle School Math(could be adapted for upper elementary)
- Complementary NJ ADAPT Resource Document
Climate Change Units:
Developed in partnership with Sustainable Jersey & Rutgers CMSCE
- The Benefit of Trees: A 15-20 Hour Project-Based Learning Unit
This free, interdisciplinary unit examines the environmental, social, and ecological benefits of trees. Designed for middle or high school sustainability or environmental science electives, it can also be used as a summer program. The training includes ready-to-use lesson plans, presentations, and student materials. Through active, inquiry-based learning, students will engage in data collection, analysis, and discussions to understand how trees address climate change. Topics include urban heat islands, carbon sequestration, equitable access to green spaces, and the positive impact of increasing tree canopy coverage on communities.
- Integrating Climate Change into Curriculum using New Jersey Resources and Datasets
This resource provides guidance on incorporating state-specific climate-related resources into OpenSciEd's 7th-grade Unit 7.6, Earth's Resources and Human Impact. These place-based learning opportunities connect climate change concepts to the real-world impacts on students’ communities and New Jersey.
Additional Resources
- Rutgers Climate and Energy Institute - Climate Education Resources
- NJ Climate Change Education Resources